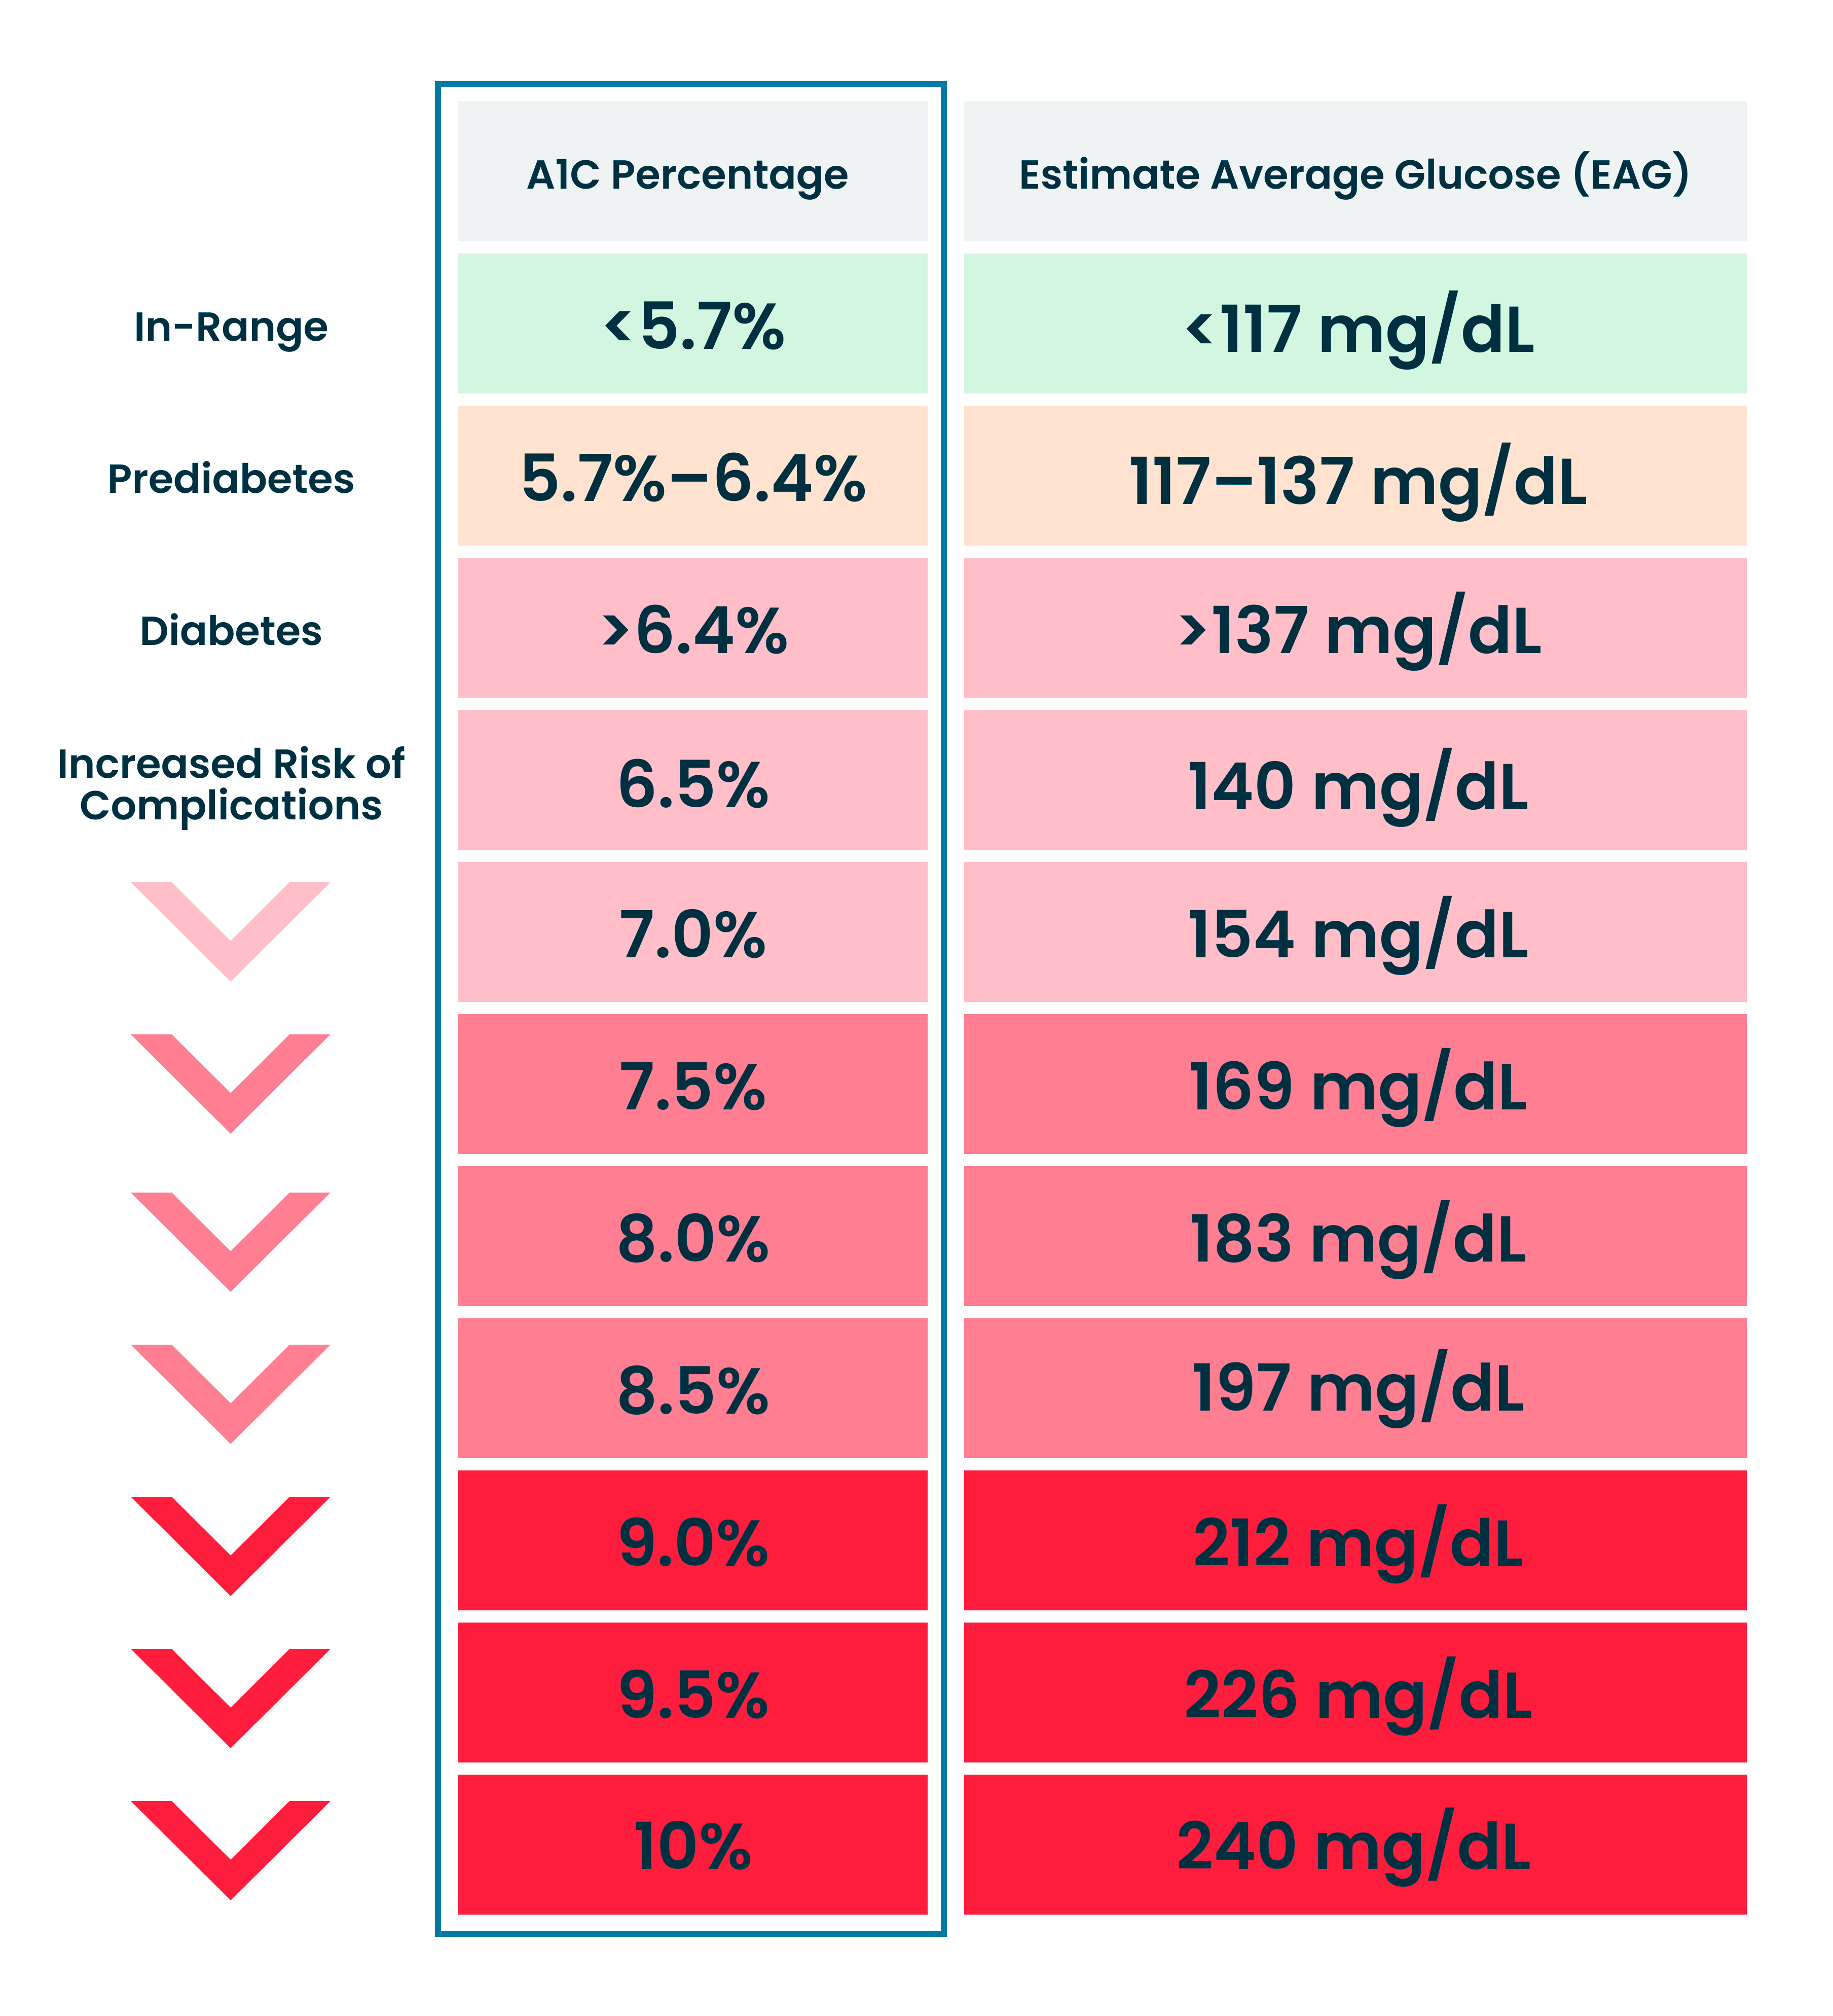
A1C, sometimes called hemoglobin A1C or HbA1c, is a blood test that estimates your average blood sugar over the past two to three months. Unlike a standard glucose test, which shows your blood sugar at one single moment, A1C reflects a longer-term pattern, which is part of why it's become a standard tool for both diagnosing and managing diabetes.
How the Test Actually Works
Glucose in your bloodstream attaches to hemoglobin, the protein in red blood cells that carries oxygen, in a process called glycation that happens naturally and continuously, without requiring any enzyme to drive it. Because red blood cells live for about three months before being replaced, measuring what percentage of your hemoglobin has glucose attached provides a reasonable estimate of your average blood sugar over that entire period.
That three-month window is actually a bit of a simplification. Because red blood cells are constantly being replaced on a rolling basis rather than all at once, your A1C result is weighted more heavily toward your more recent blood sugar, roughly the last four to six weeks, than toward blood sugar from two or three months ago. This is part of why A1C can shift meaningfully within just a few weeks of a real change in blood sugar control, rather than requiring the full 90 to 120 days to reflect improvement or decline. No fasting is required for an A1C test, which is one practical advantage over a fasting glucose test.
A Relatively Recent Standard
Fasting glucose and the oral glucose tolerance test were the only tools used to diagnose diabetes for decades. The American Diabetes Association didn't formally add A1C as a diagnostic option until 2010, once testing methods had become standardized enough across labs to be trusted for that purpose. That standardization effort, coordinated through a program called the National Glycohemoglobin Standardization Program, is part of why an A1C result from one lab can be meaningfully compared to a result from a different lab years later.
An A1C below 5.7% is considered normal. A result between 5.7% and 6.4% falls into the prediabetes range, indicating blood sugar that's higher than normal but not yet in the diabetes range. An A1C of 6.5% or higher on two separate tests is generally used to diagnose diabetes. For people already diagnosed with diabetes, providers often set an individualized target, commonly below 7%, though this can be adjusted based on age, other health conditions, and how long someone has had diabetes.
Why Targets Get Individualized
A tighter target, sometimes below 6.5%, may be appropriate for someone who is younger, otherwise healthy, and early in their diagnosis, since they have more years ahead of them to benefit from tight control and fewer competing health risks to weigh against it. A more relaxed target, sometimes below 8%, is often chosen for someone older, with a history of severe low blood sugar episodes, limited life expectancy, or other significant health conditions, since the risks of aggressively chasing a very low A1C, particularly dangerous hypoglycemia, can outweigh the benefits in that specific situation. Neither target is more correct in the abstract; the right number depends on weighing benefits and risks for your specific circumstances.
Translating A1C Into a Number You Can Picture: Estimated Average Glucose
A percentage like 6.5% doesn't mean much on its own if you're used to seeing blood sugar numbers on a glucose meter. To bridge that gap, researchers developed a conversion called estimated average glucose, or eAG, using the formula eAG (mg/dL) = 28.7 x A1C - 46.7, based on a large international study that directly compared A1C results to continuous glucose monitoring data.
Using that formula, an A1C of 5.7% works out to an eAG of about 117 mg/dL, 6.5% works out to about 140 mg/dL, 7.0% works out to about 154 mg/dL, and 8.0% works out to about 183 mg/dL. Many labs now report this eAG number alongside your A1C percentage specifically to make results easier to compare against the daily readings on a glucose meter or continuous glucose monitor.
A1C vs. Daily Glucose Monitoring
A1C and day-to-day glucose readings answer different questions and work best together. A1C shows the bigger picture average, but it can't show the ups and downs within a day, meaning two people with an identical A1C could have very different patterns, one with stable moderate readings all day and another swinging between low and high extremes that happen to average out to the same number. Daily monitoring fills in that detail that A1C alone can't capture.
Why Your A1C and Your Glucose Meter Might Not Quite Agree
Even accounting for the recency weighting described above, some people notice their A1C runs consistently a bit higher or lower than their own glucose readings would predict. This isn't necessarily an error in either measurement. Individual red blood cells glycate, meaning pick up glucose, at somewhat different rates from person to person, a phenomenon researchers call the hemoglobin glycation index. Someone who is a naturally faster glycator will tend to run a higher A1C than their actual average glucose would suggest, and a slower glycator will tend to run lower. This individual variation is a real, studied phenomenon, not a measurement flaw, and it's part of why providers pay attention to your own consistent pattern over time rather than treating any single A1C number as an absolute, universal truth.
What Can Skew an A1C Result
Certain conditions can make A1C less reliable as a stand-alone measure, mostly because they affect red blood cells directly rather than affecting blood sugar. Anemia, other blood disorders affecting red blood cells, recent significant blood loss, or a recent blood transfusion can all shift the result in ways that don't reflect actual average blood sugar, generally by changing how long red blood cells survive in circulation. Certain inherited hemoglobin variants, including sickle cell trait, can also interfere with some A1C testing methods, which is part of why lab results sometimes note the specific method used. Kidney disease can also affect A1C accuracy in some cases. If you have one of these conditions, your provider may rely more heavily on direct glucose monitoring alongside or instead of A1C.
Lab Tests vs. Point-of-Care Tests
A1C can be measured either by sending a blood sample to a laboratory or with a point-of-care device that gives a result during the same office visit. Point-of-care tests are convenient, but they've historically shown somewhat more variability than laboratory-based methods, which is part of why a diagnosis of diabetes generally requires confirmation through a certified laboratory test rather than a point-of-care result alone.
A1C Isn't Used for Every Situation
Despite how central A1C has become to diabetes care, it isn't the right tool for every situation. During pregnancy, gestational diabetes is diagnosed using a glucose tolerance test rather than A1C, partly because normal pregnancy changes both blood volume and red blood cell turnover in ways that can make A1C less reliable, and partly because gestational diabetes develops over a much shorter window than the three-month period A1C is designed to reflect.
How Often You Should Get Tested
For people without diabetes, A1C is typically checked as part of routine screening, especially with risk factors present, roughly every one to three years. For people with diagnosed diabetes and stable, well-controlled blood sugar, testing about twice a year is standard. For people whose treatment has recently changed or who aren't yet meeting their target, testing quarterly is more common, since it takes a few months for a treatment change to fully show up in the result.
Why Even Small A1C Improvements Matter
The reason providers pay close attention to A1C isn't abstract. Two of the largest diabetes trials ever conducted, the UK Prospective Diabetes Study for type 2 diabetes and the Diabetes Control and Complications Trial for type 1 diabetes, both found a direct relationship between A1C and long-term complications. Analysis of the UKPDS data found that each single percentage point reduction in A1C, for example going from 9% to 8%, was associated with a 37% reduction in the risk of microvascular complications like kidney and eye disease, a 21% reduction in the risk of any diabetes-related complication or death, and a 14% reduction in heart attack risk. The DCCT found similarly large benefits in type 1 diabetes, with intensive control achieving about a 2-point lower A1C associated with a 60% reduction in microvascular complications over about seven years of follow-up.
These numbers are part of why even a modest, sustained A1C improvement, not just reaching a perfect number, translates into a meaningfully lower long-term risk of the complications diabetes is most known for.
Using A1C to Guide Your Care
Your A1C result isn't just a label, it's a tool your provider uses to decide whether your current treatment plan, whether that's lifestyle changes, medication, or both, is working or needs adjustment. A rising A1C over time, even while still in range, can be an early signal worth discussing before it progresses further.
A1C is also typically considered alongside other numbers, like blood pressure and cholesterol, as part of a broader picture of cardiometabolic risk, since diabetes and its complications rarely show up as a single isolated number in isolation from the rest of your health.
Due for an A1C check, or want to understand a recent result? CareArc's primary care team can help. Request an appointment to get started.